The Gillian Debugger
The Gillian debugger provides a custom interface for visualising symbolic execution and unification, via a bespoke VSCode extension.
Danger
The debugger is still in development; expect bugs, missing features, and breaking changes!
Feel free to report any issues or feature requests.
Setup
The debugger is used via a custom VSCode extension, found under the debug-ui/ directory in the repo.
To try out the debugger, follow these steps:
Install the base Gillian extension
Make sure Gillian is built (see Installation)
cd into
debug-ui/Run
yarnto set up dependenciesRun
yarn buildto build the extension (oryarn watchto rebuild automatically)In the Run and debug tab of VSCode, make sure Debugger Extension is selected from the dropdown, and click the green play button to start the extension
A new VSCode window should open in
debug-ui/examples/, with the extension installedIn this window, open the workspace settings, and under the Extensions > Gillian Debugger section:
Make sure Run mode is set to
sourceSet Source directory to
${workspaceFolder}/../../If you want to disable automatic folding and unfolding of predicates, check Use manual proof
A Guided Tour
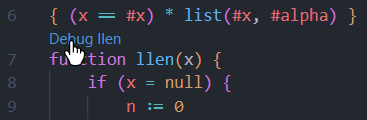
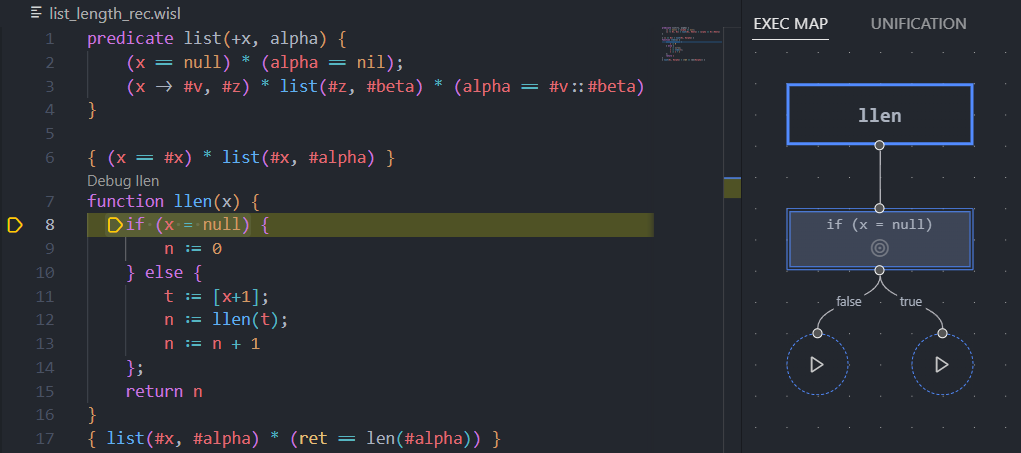
Let's take it for a spin! Open list_length_rec.wisl, and click Debug llen to start the debugger.
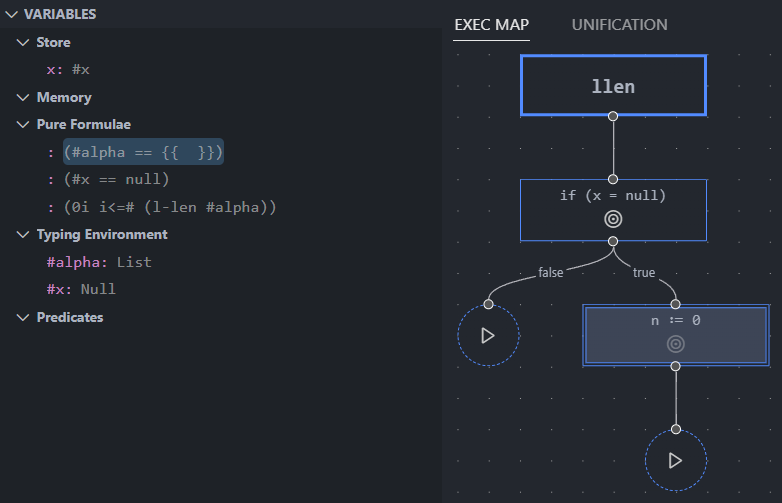
You should then be presented with a new panel showing the path of execution in a graph. Here you can see the current command in the highlighted node, and two subsequent commands yet to be executed.
In the left-hand panel, you can see the current state of symbolic execution.
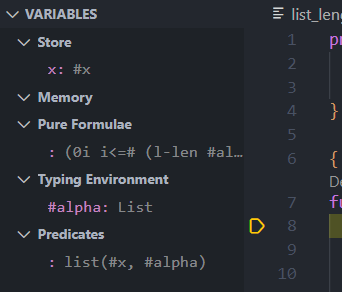
Each section of the state represents:
Store: The values of program variables
Memory: Memory assertions, e.g. the contents of the heap
Pure Formulae: Pure (i.e. first-order logic) formulae
Typing Environment: Variable types
Predicates: Any known predicates
Tip
Take care to remember that the Memory section may not tell the full story of the heap; some information may be 'hidden' in the definitions of Predicates.
Click on the play button under the true branch to execute the next command (in the true case of the if-else). Notice how our Pure Formulae have updated to show that we now know #x is null.
Now, click the target button  on the first command to 'jump' back to it. Gillian stores the full trace of execution, so you can jump back and forth, and across branches, as you please.
With the first command selected, click the Continue button in the standard debugger controls to fully execute the rest of the program. You should see execution complete with no errors, and all unifications succeeding - lucky us!
You'll know a unification has occurred when a Unify badge appears on the command node. In this case, the function is returning, so Gillian has unified with the post-condition. Let's take a closer look; when a command with a unification is selected, click the UNIFICATION tab at the top to look into the unification process.
In unification, Gillian attempts to match the state against a sequence of assertions (called a unification plan). Click the target button on one of the assertions to see what's been learned so far.
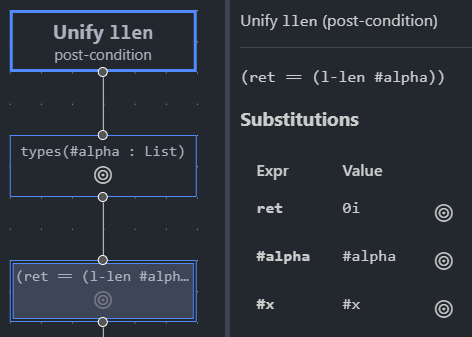
If unification has failed, the offending assertion will be highligted in red.
Caution
As of the time of writing, the debugger has only been tested with wisl - you're free to try other target languages, but do so at your own peril!
Technical Details
The Gillian debugger started life as a strict follower of the Debug Adapter Protocol. However, the DAP was designed with concrete execution in mind, thus proving too restrictive for the non-linearity of symbolic execution. However, the exensibility of the DAP, together with the power of VSCode extensions, allowed us to transcend these restrictions with a custom interface (while, unfortunately, sacrificing near free-of-charge cross-IDE support).
The Gillian debugger's "stack" consists of:
The Webview is the custom interface, built as a React single-page-app. It is built separately from, and 'embedded' into, the VSCode extension, using VSCode's provided message passing API to communicate with the extension (and by extension, Gillian).
The Extension acts as a middleman of sorts; it tells VSCode how to run Gillian in debug mode, initialises a debugger session, and passes messages between Gillian and the webview.
Gillian is the core of the debugger; it performs the actual symbolic execution and unification. It uses custom events and commands alongside the provided DAP ones to bidirectionally communicate with the extension.
Credit goes to the authors of React Flow, the library responsible for core parts of the debugger interface.